Perhaps the most important parts of the Cape May Monarch Monitoring Project is the census that we conduct. Our census is modification of a technique known as a “Pollard Transect,” whereby a specified route is traveled on a regular basis and butterflies counted by the observer while traveling. Our census is conducted daily from September 1 to October 31, and consists of a slow drive along a 5-mile route that leads from the west end of New England Road to Alexander Avenue in Cape May Point. One observer drives at roughly 20 miles per hour and counts all of the monarchs observed along the route. The census is conducted three times a day from September 1 to October 15, and then twice a day from October 16 to 31. The number of monarchs seen along the route and the time of travel are recorded and then calculated to monarchs observed per hour. These data are used to compare one year to another. This census has been faithfully conducted every year since 1992, giving us 29 years of data. Our data are summarized on a weekly and annual basis in this chart:
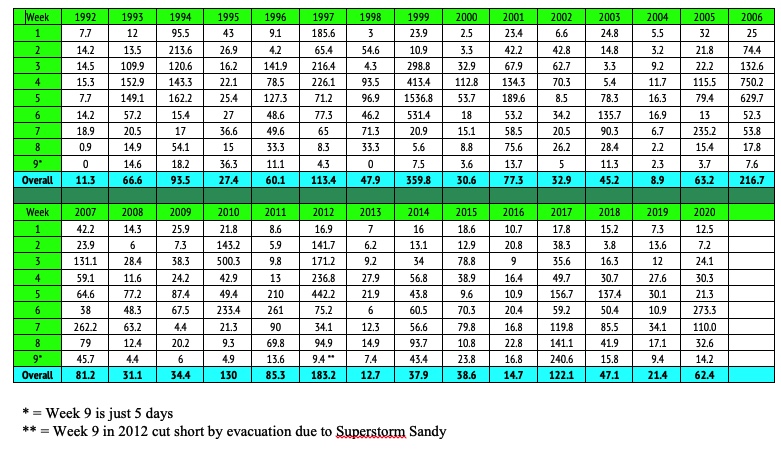
So how did 2020 compare to other years? It was a good year of migration, with the 13th highest yearly average of monarchs observed per hour, 62.4, slightly above the median. Putting it another way, 12 years have had a higher average but 16 have had lower. There are many variables that affect the census numbers from year to year, but two seem to be most significant. One is rather obvious: when the monarch population is high, we can expect to see more monarchs in Cape May. The other significant variable is weather, with wind direction being the most significant. A westerly component to the winds is likely to cause many monarchs to drift eastward, and if they end up on the east side of Delaware Bay, their preference to stay over land as long as possible will funnel them into Cape May. Conversely, when the wind is blowing from the east, many monarchs coming from the north are likely to end up on the west side of Delaware Bay, bypassing Cape May altogether. The same situation has been observed and is well documented with migratory birds, which are seen in the greatest numbers during the southbound migration when winds are from the west or northwest. We saw favorable winds more frequently this fall than in many recent years.

Small roost of monarchs at Cape May Pt. State Park, Oct. 5, 2020
Large average monarchs/hour totals for weeks 6 and 7 correspond to a 2-week period during the first half of October when monarchs were plentiful around Cape May. It’s quite unusual for Cape May to have consistently high numbers for two solid weeks, usually our peak numbers occur for just a few days at a time, though often we will see several peaks during the two-month migratory period. Even though travel is severely limited this year due to the COVID-19 pandemic, and our education program was severely curtailed as we insisted on compliance with all pandemic precautions, we were able to help many local residents see and appreciate monarch migration during this period, and many more enjoyed the abundance vicariously through our social media posts.

Monarchs roosting in ivy at Cape May Point, October 11, 2020
When you look at our 29 years of census data, it’s noteworthy that while the numbers have some dramatic fluctuations (our highest yearly total is more than 40 times higher than our lowest year), the overall trend seems generally stable. Some biologists have looked at our data and argued that it indicates that monarch populations are in good shape. We are very reluctant to jump to that conclusion. Monarchs funneled through Cape May are a very small percentage of the numbers found all across the continent. Censuses at the wintering areas in Mexico show dramatic declines in monarch numbers. If monarchs in Cape May are doing okay for some reason, it certainly doesn’t imply that monarchs everywhere are equally well.
Thanks for reading,
Mark Garland


