By Anna Haggenjos and Maya Clark
Research
The Project:
The Monarch Monitoring Project, under New Jersey Audubon’s Cape May Bird Observatory, seeks to increase our understanding of butterflies and their migration, promote the conservation of monarch butterflies, and educate the public. The project was founded by wildlife enthusiast, Dick Walton, and monarch biologist, Dr. Lincoln Brower, in 1990. Today, the project is the longest-running research project on any migratory insect in the world. As these butterflies complete this multigenerational, transcontinental journey of over 2,500 miles, we strive to be a leading force in the scientific observation and quantification of this yearly migration.
Cape May is world renowned for the migration that can be observed here. Millions of migratory animals, including birds, bats, dragonflies, and butterflies, travel through Cape May on their journeys to their overwintering areas. Since Cape May is located on a south-facing peninsula on the east coast, and there is a predominant northwest wind type in the fall, many species get funneled into Cape May during this time of the year. At Cape May Point we are surrounded on three sides by water with a 13-mile distance to Delaware. Crossing the bay is quite dangerous for migratory species as winds can blow these animals off course. Therefore, migrants will stop at the Point to build up fat reserves and rest before continuing their trek south.
Monarchs can congregate in large numbers in Cape May as they wait for the appropriate wind and weather conditions to cross the Delaware Bay. Since these butterflies are so light, they can easily be blown out over the ocean. To continue their journey south, these delicate butterflies must either wait for a light northeast wind and clear, warm weather to help push them across the bay, or make the journey up the bayshore where the distance for crossing the bay is shorter. The geography, weather, and winds in this area make Cape May one of the best places to witness and study monarch migration. Furthermore, due to the large portion of monarchs that end up at Cape May Point during their journey to Mexico, the data collected on monarchs here is likely a good representation of monarch population numbers across the northeast.
Depending on factors including, but not limited to, wind and weather, monarch numbers in Cape May can vary from year to year. Despite fluctuations in monarch numbers in Cape May, the average number of monarchs appears to be consistent over the past 30 years. Nonetheless, analyzing the characteristics of a given season can provide insight into monarch populations and migration dynamics. This report summarizes our census data, tagging numbers, general observations, programs, volunteer involvement, and notable events for this year’s field season (which ran from September 1st to November 14th).
Population Census:
How road census data is collected:
The road census, developed in 1991 and officially conducted in 1992 by Dick Walton and Dr. Lincoln Brower, is a 5.5 mi route that starts at Higbee Beach. The census continues down New England Rd, onto Bayshore, Sunset Blvd, and Lighthouse before taking several turns onto roads that hug the dunes. Walton and Brower designated this course because it runs along several habitat types including forests, agricultural fields, residential areas, and dune systems. Census data is collected three times a day from September 1st to October 14th, then just twice a day from October 15th to November 7th. Monarchs are counted with a clicker and then converted into an average number of monarchs per hour.

A magnet is placed on the back of the data collector’s vehicle as they conduct the road census. Photo by Maya Clark.
This year’s numbers compared to previous:
Monarchs per hour this season were 14.13/hr, the fourth lowest year on record since 1992. This is an 80% drop from last year’s number of 71/hr, and the last time monarchs per hour were this low was in 2016. Compared to last year, which experienced one major push, there was no major migration push of monarchs that moved through Cape May Point this fall. Monarch numbers stayed elevated through week 6, but individual census counts never surpassed 31 monarchs.
Interestingly, numbers seem to dip around every 3 years since the early 2010s. In 2013 there was an average of 12.7/hr, in 2016 the average was 14.7/hr, and in 2019 the average was 21.4/hr.
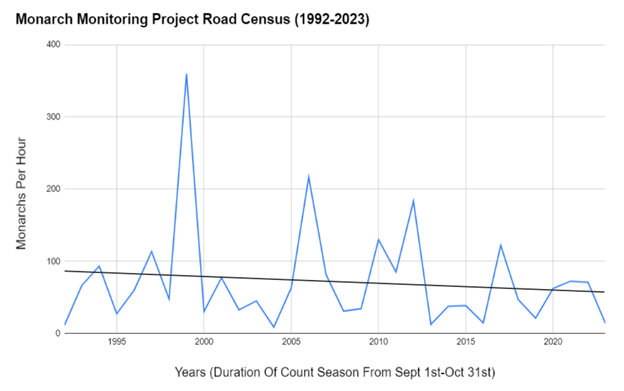
A line graph of the average number of monarchs per hour traveling through Cape May from 1992 to 2023.
Why this year might be low:
This season saw a reduced number of monarchs moving through Cape May than in previous years. Several locals commented on how they were seeing fewer monarchs in their gardens than in years prior. While numbers were low locally, that does not mean population numbers were low nationwide this year. Several factors could have contributed to this, including the lack of northwest winds that usually dominate in the fall. After taking 166 wind counts, only 27.7% of them had both northerly and westerly components. Without northwest winds, monarchs won’t be funneled down to Cape May Point and instead continue down the coast. On September 23rd, the remnants of Tropical Storm Ophelia brought NE winds over 35mph to Cape May. The following week brought northeast winds consistently, which would have pushed monarchs away from the coast or over Delaware Bay. It is also possible that wildfires in Canada had an impact on breeding monarchs over the summer.
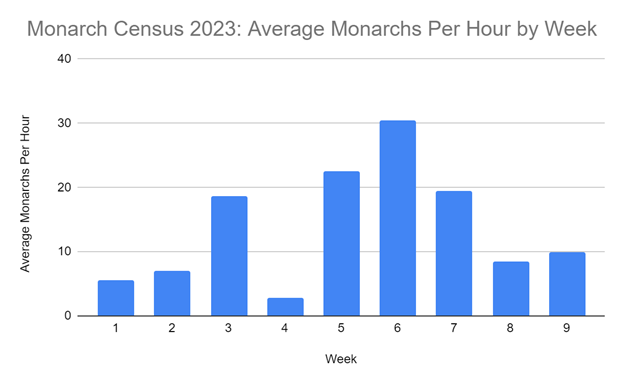
A bar graph showing the average number of monarchs per hour traveling through Cape May per week during the 2023 season. Data was collected from September 1st to November 7th.
Cloudless Sulphurs:
For the past 4 years, the Monarch Monitoring Program has also been counting another species of butterfly, the Cloudless Sulphur. Cloudless Sulphurs migrate north in the fall along the East Coast to take advantage of their host plants senna and partridge pea. While their migration is not fully understood, two different generations of these butterflies may be flying both north and south during the fall.
Tagging:

Monarch Field Naturalist, Maya Clark, collecting data on the wing length of the monarch butterfly during the tagging process. Photo by Adehl Schwaderer.
We tag monarch butterflies to gain more data and information on the routes, speed, and stopping points that they take when migrating. We are also able to gain insight into how many monarchs make it to the overwintering grounds in central Mexico from Cape May, NJ. Since 1992, the Monarch Monitoring Project has used tags developed and distributed by Monarch Watch out of the University of Kansas. These tags are designed to be light enough to be placed on the hindwing of the butterfly and not impair the butterflies’ flight behavior. Weighing just a hundredth of a gram, the tag is only 2% of a monarch’s body weight. Each tag has a unique alphanumeric code, four letters and three numbers, to identify and associate data with that butterfly. When the tag is observed and the code is reported to the Monarch Watch website by a citizen scientist or a recovery team, information about where the monarch was found and the condition of the butterfly is reported back to us.
When tagging, we take data points on the fat content, sex, wing condition, wing length, as well as the date, time, and location of release. All this data can be used to increase our knowledge of what factors contribute to migration success of monarch butterflies. The data we collect on fat content can also provide insight into the habitat quality of the surrounding area or areas north of Cape May that the butterfly has traveled through. For example, higher levels of fat content indicate that nectar and food sources are adequate for building fat reserves needed to make the long migratory journey to Mexico.
This season, with the help of the Monarch Field Naturalists, Field Coordinator, and our dedicated volunteers, we have tagged 2,698 monarch butterflies. The majority of monarchs caught were male. Of the monarchs caught and tagged this season 67.61% were male and 32.39% were female. The average fat content (measured on a scale of 1 to 4 with 4 indicating the highest amount of fat content) of monarch butterflies caught by MMP staff was 3.15. The average wing length of both males and females caught by MMP staff was 52.67 mm.
Roost Counting:

Monarch butterflies roosting on evening of October 16th at the corner of Cape Ave and Lincoln Ave. Photo by Maya Clark.
Roosting behavior occurs when temperatures begin to drop. Butterflies are cold-blooded and cannot regulate their body temperature, so cooler temperatures make it difficult for monarchs to move and fly. Therefore, monarchs will roost together in conifer trees. There are still many unanswered questions about why and how monarchs form these roosts, but the leading hypothesis is that these butterflies gather for protection against wind, weather, and predators. Roosting together gives the butterflies strength in numbers if a predator were to appear. The mass gathering of these monarchs all over a single tree, or branch, with their wings closed and concealed, additionally creates an illusion of camouflage as if the monarchs weren’t even there at all. They blend in better together by covering a large area, appearing as mere leaves, or simply fading into the texture of the trees. Even for humans, it can take a few seconds for your eyes to adjust to see them, even when you know they are there!
There is also some speculation that roosting communally together may help internalize warmth and individual protection. The number of monarch butterflies in a roost can vary from just a couple individuals to hundreds, or even thousands of butterflies. When monarchs leave a given roost, released, communicative pheromones are left behind. When these chemical pheromones are picked up by the next wave of migratory monarchs, those individuals will know to gather there, as it must have been a safe site for the previous migrants to roost. This often results in just a handful of sites becoming popular roosting places throughout the fall.
This season we found a few small roosts along the dune crossings of both Saint Peter’s Beach and on Lincoln Avenue in Cape May Point. These small roosts mostly did not exceed 10-15 monarchs. However, there was one roost site in mid-October on the corner of Cape Ave and Lincoln Ave where we counted 87 monarchs. Monarchs were found at this roost site for approximately 48 hours. As mentioned above, these lower roost numbers are likely due to infrequent northwest winds that are typically predominant in the fall. A low breeding year north of us could also have played a role in the reduced numbers of monarch roosts, due to there being simply fewer monarchs around. Furthermore, Cape May did not have many nights that dropped below 55°F in September and October. September had 2 nights that dropped below 55°F, and October had 17 nights that dropped below 55°F. This lack of cooler temperatures may have also contributed to the low roost numbers this year, as typically in a fall season we’ll see roosts by as early as late September.

Monarch butterflies roosting in the morning on October 16th at the corner of Cape Ave and Lincoln Ave. Photo by Maya Clark.
Outreach and Education
In-person Engagement:
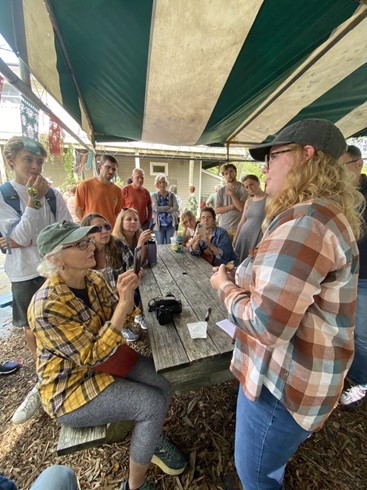
Monarch Field Naturalist, Anna Haggenjos, speaking to an interested crowd about monarch butterflies during the Monarch Festival on October 1st. Photo by Adehl Schwaderer.
One of the main goals of the Monarch Monitoring Project’s is to educate the public about monarch biology, conservation, and tagging. We held tagging demonstrations at the state park on Fridays, Saturdays, and Sundays at 2 p.m., along with informal drop-ins at Triangle Park in Cape May Point on Wednesdays and NJA’s Nature Center of Cape May on Mondays. With five programs a week from September 8th to October 22nd, we had several opportunities to interact and educate the public. This fall, we attended the East Point Lighthouse Festival on September 16th and 17th and set up a table for both days. That weekend, we talked to 310 visitors about the Monarch Monitoring Project and monarch conservation.
During the Nature Center of Cape May’s Monarch Festival, held on October 1st, we held five shortened tagging demos around 30 minutes in length. A total of 450 visitors attended these demos. In September, 670 participants attended our formal Tagging Demonstrations held at Cape May Point State Park. In October, the number doubled to 1,353 participants for our programs, meaning in total the project taught 2,023 people at the Cape May Point State Park this season.
Volunteer Support:
We are very grateful for the wonderful support from our dedicated volunteers and staff. In total, the Monarch Monitoring Project volunteers put in 246.5 hours educating the public and tagging butterflies this fall. We’d like to thank our amazing volunteers, Karen McClennen, Betty Ross, Marg Salvia, Jan Zimmerman, Sue Slotterback, Patti Domm, Margaret Flinner, Donna Murray, Nancy Markle, Patsy Eickelberg, Diane & Dan Tassey, Gayle Steffy, Jane Branigan, Kelianne O’Shea, our previous Director Mark Garland, our previous Field Coordinator Louise Zemaitis, for all their help this season. Additionally, we want to say a special thank you to our current Field Coordinator, Jack McDonough, and this season’s Monarch Field Naturalists, Anna Haggenjos and Maya Clark, for all their hard work and support this season.
Thank you all for an incredible season and the Monarch Monitoring Project is looking forward to another year of continuing our education, research, and conservation efforts!


